Contact Download
EN

Block models

How to estimate a block model by kriging

A block model estimate (resource estimation by ordinary kriging or inverse distance) takes five steps in Crosscut: build the model from the drillhole samples and estimate the grades, colour the cells by grade, get the tonnage by bench, draw the grade-tonnage curve and write the resource report.
How to estimate a block model by kriging

1. Build a model from samples and estimate grades

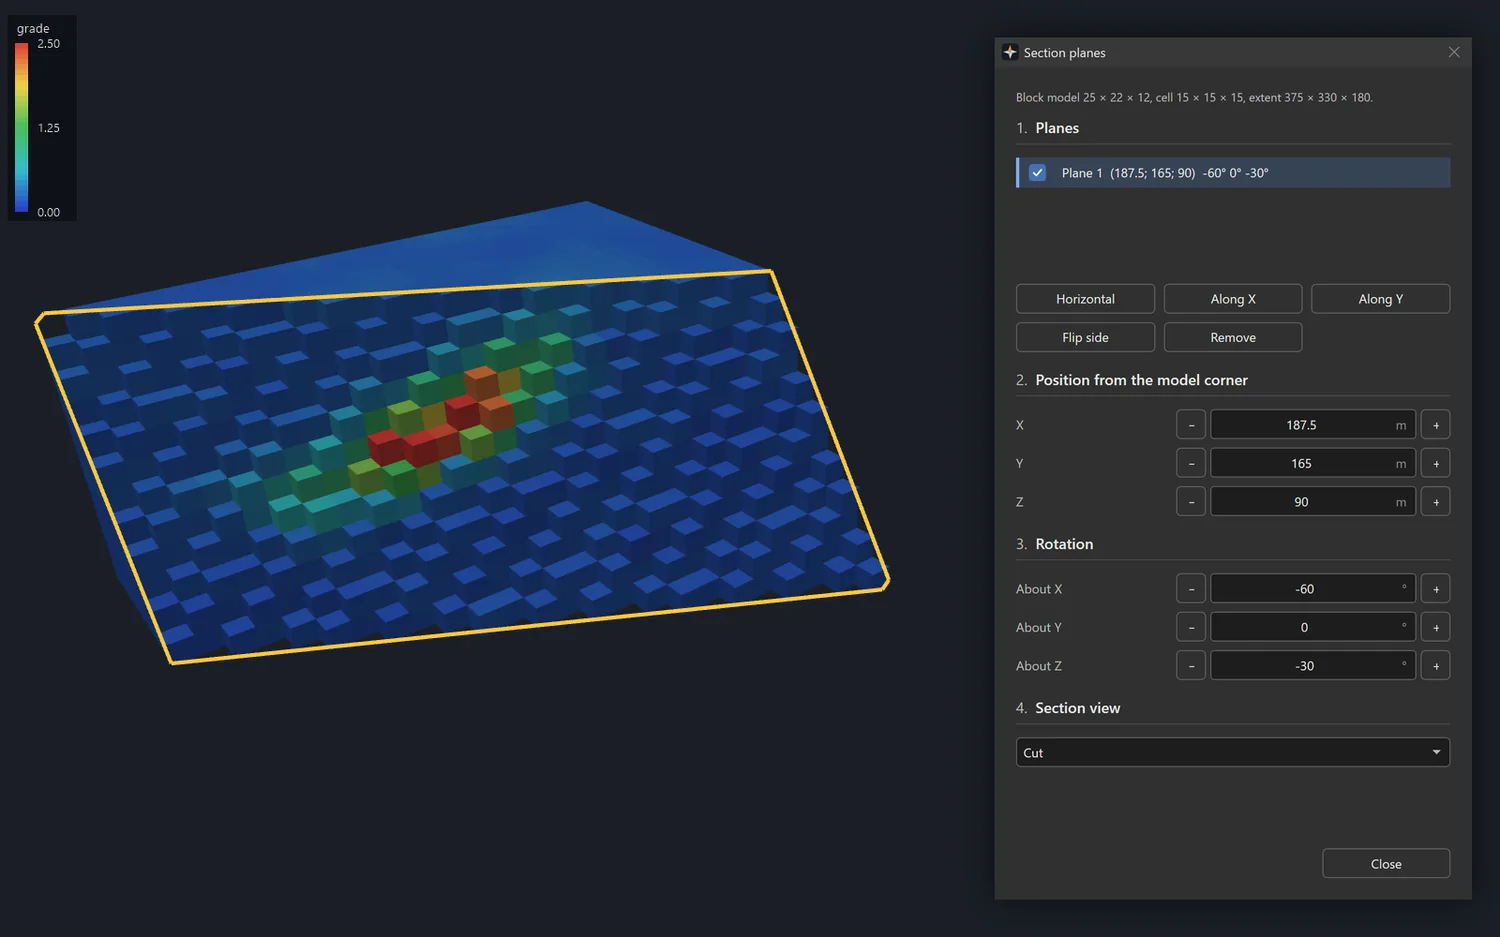
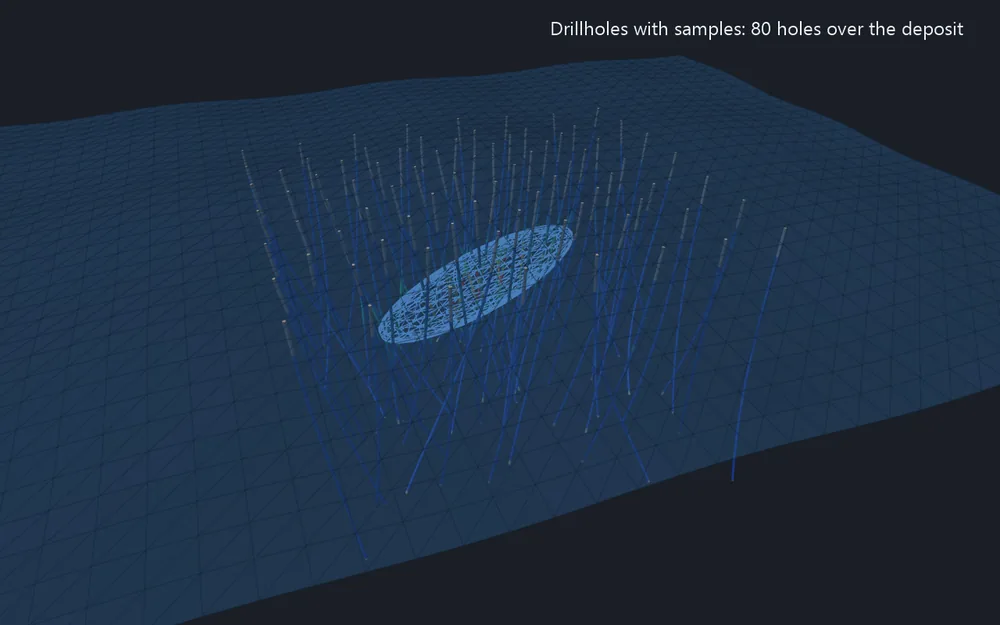
The holes, the samples in their cells, the estimated model, then its cells of grade 0.5 and above

Import samples puts each sample into the cell it falls in; cells no sample reaches stay empty. Estimate from drillholes then fills the cells from the samples of the holes, in a search ellipsoid.

  1. Run the Import samples tool, choose a CSV, TSV or TXT file with X, Y and Z columns and set the cell size.
  2. Run the Estimate from drillholes tool and choose the table, its column and the column of the model to write.
  3. Choose the method: inverse distance, nearest sample or ordinary kriging.
  4. Set the search radii and the number of samples a cell takes, and click Estimate.

Result: a column of estimated grades, written in one undoable step; the model is coloured by it.

Read more in the guide →
2. Colour the model by grade

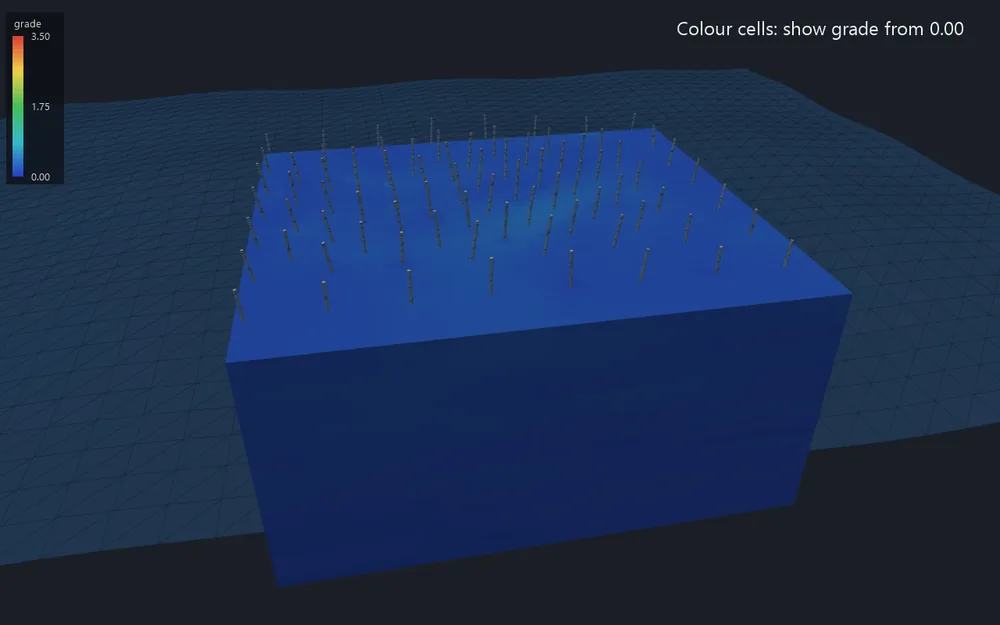
Show from raised step by step: the low-grade cells go, the ore body stays

Cells are painted by a numeric column along a colour scale, or each in the colour of its rock. Cells outside the visible range are hidden, and the 3D view follows every change at once.

  1. Run the Colour cells tool and choose a column in Colour cells by.
  2. Choose the palette and the scale, or click Auto for the column’s smallest and largest value.
  3. Enter Show from / to to hide the cells below or above those values.
  4. Click Close; Turn off shows the models as boxes again.

Result: the model in colour with a colour key over the 3D view; the colouring is not saved with the project.

Read more in the guide →
3. Get the tonnage by bench

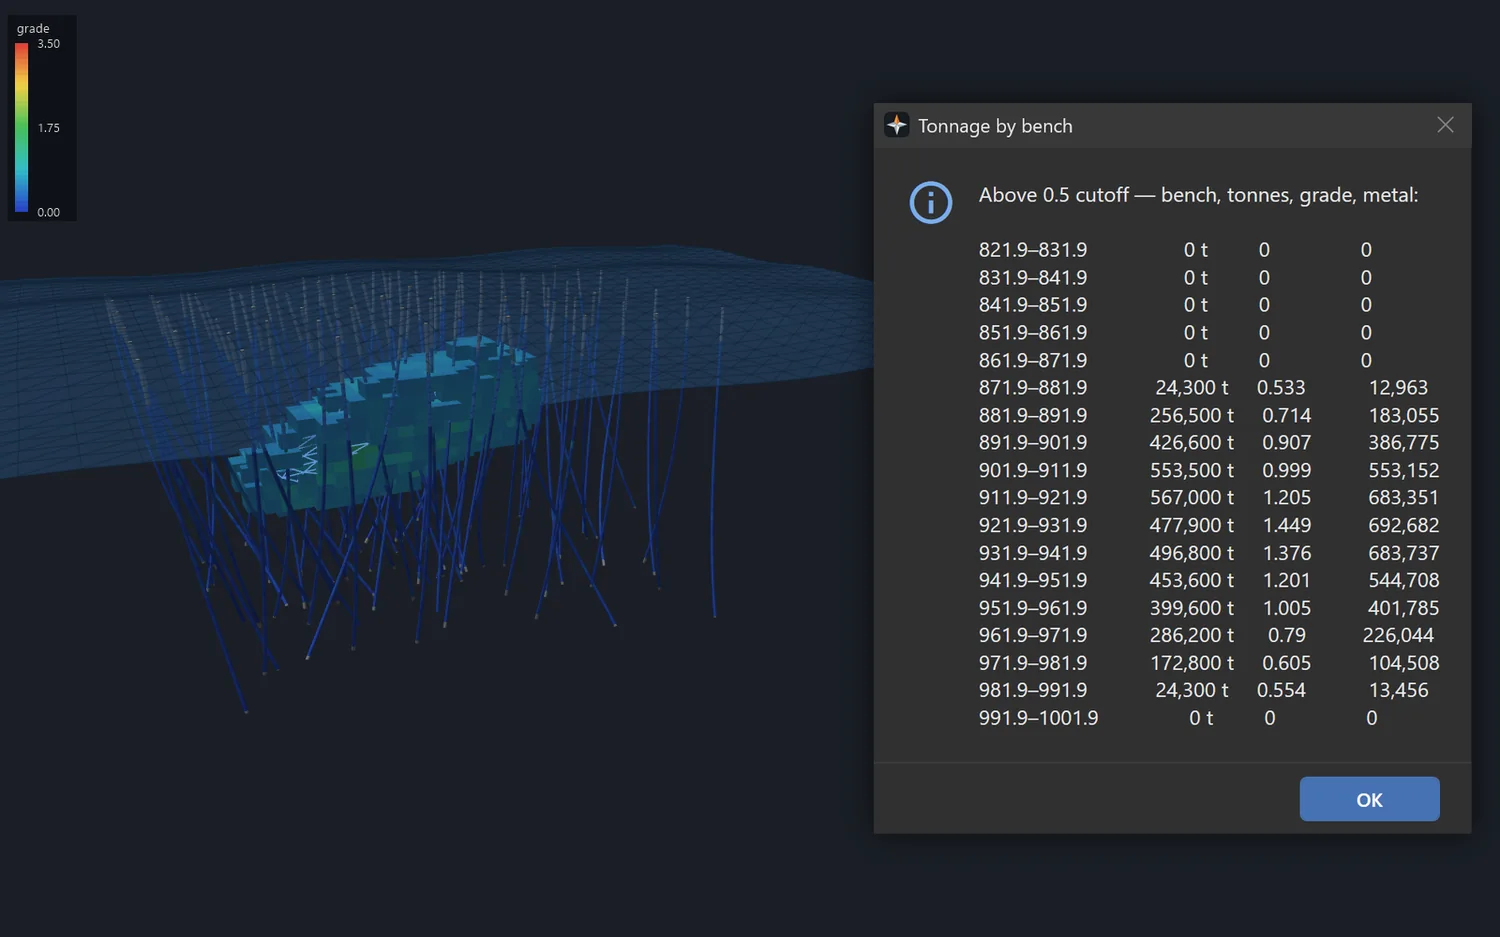
The message over the cells it counts: those of grade 0.5 and above

One row per Z layer of the model: tonnes, grade and metal above a cutoff of 0.5, from the column named grade. A cell is weighed by the density of its rock where the rock has one.

  1. Make sure the model has a column named grade; rename one with the Columns tool if needed.
  2. Open the Tonnage drop-down in the Block model group.
  3. Click the Tonnage by bench tool and read the rows in the message.
  4. For another cutoff or column, use the Resource report tool with Elevation from / to.

Result: a message with the bench, tonnes, grade and metal of every layer.

Read more in the guide →
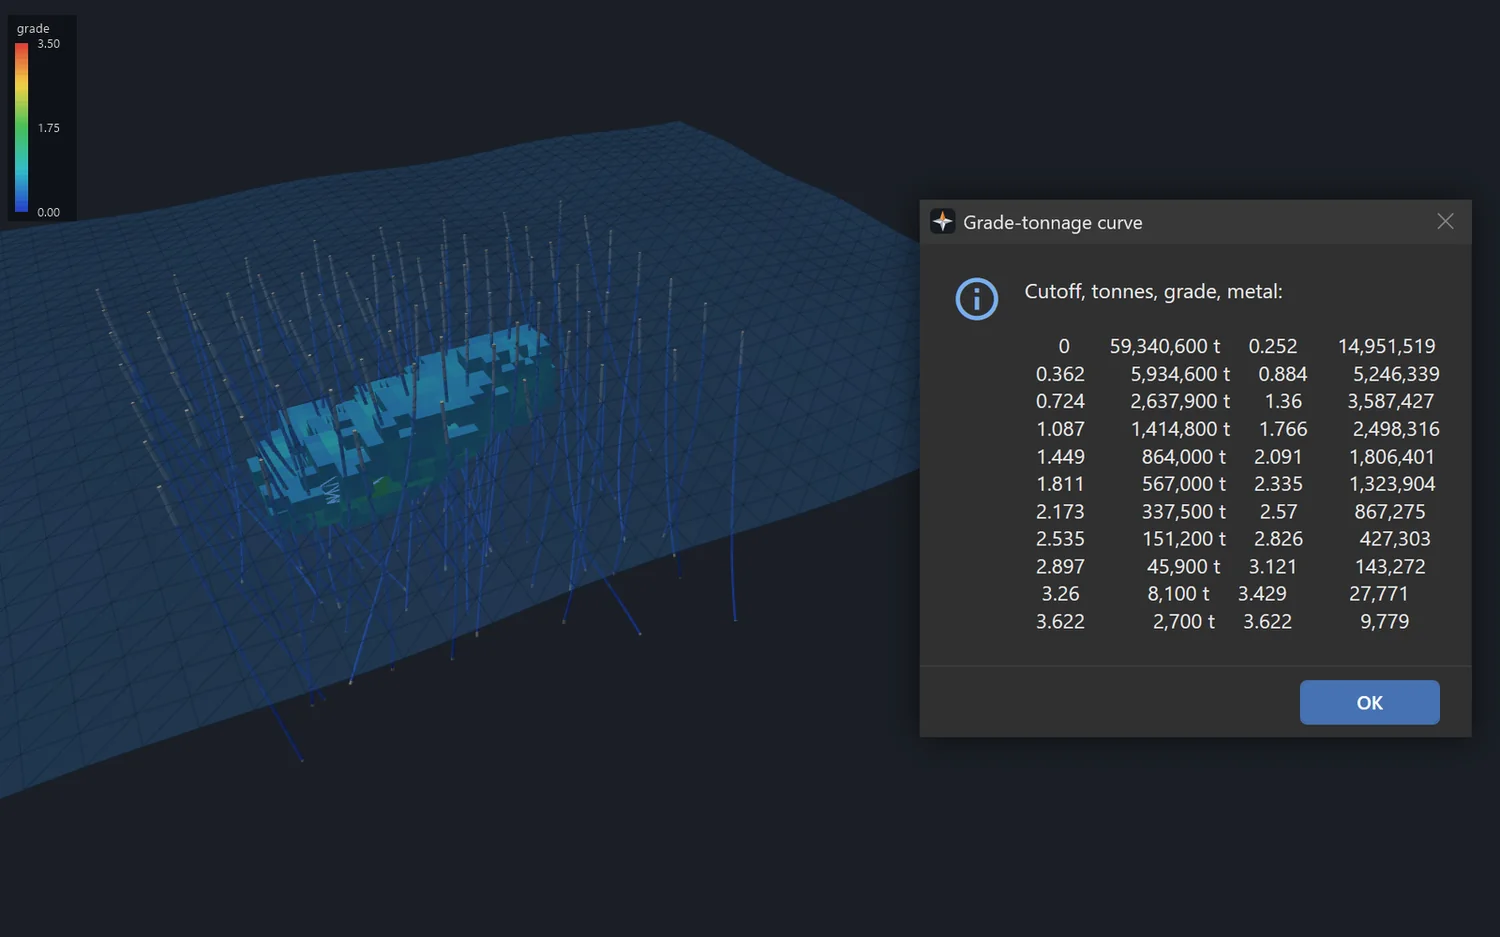
4. Read the grade-tonnage curve

Read the grade-tonnage curve

The curve comes as a table of numbers, not a chart: tonnes, mean grade and metal of the column named grade, at cutoffs from 0 to its highest value in ten equal steps.

  1. Make sure the model has a column named grade with values.
  2. Open the Tonnage drop-down in the Block model group.
  3. Click the Grade-tonnage curve tool.
  4. Read the cutoff, tonnes, grade and metal in the message; Ctrl+C copies its text.

Result: a message with one row per cutoff, ready to copy.

Read more in the guide →
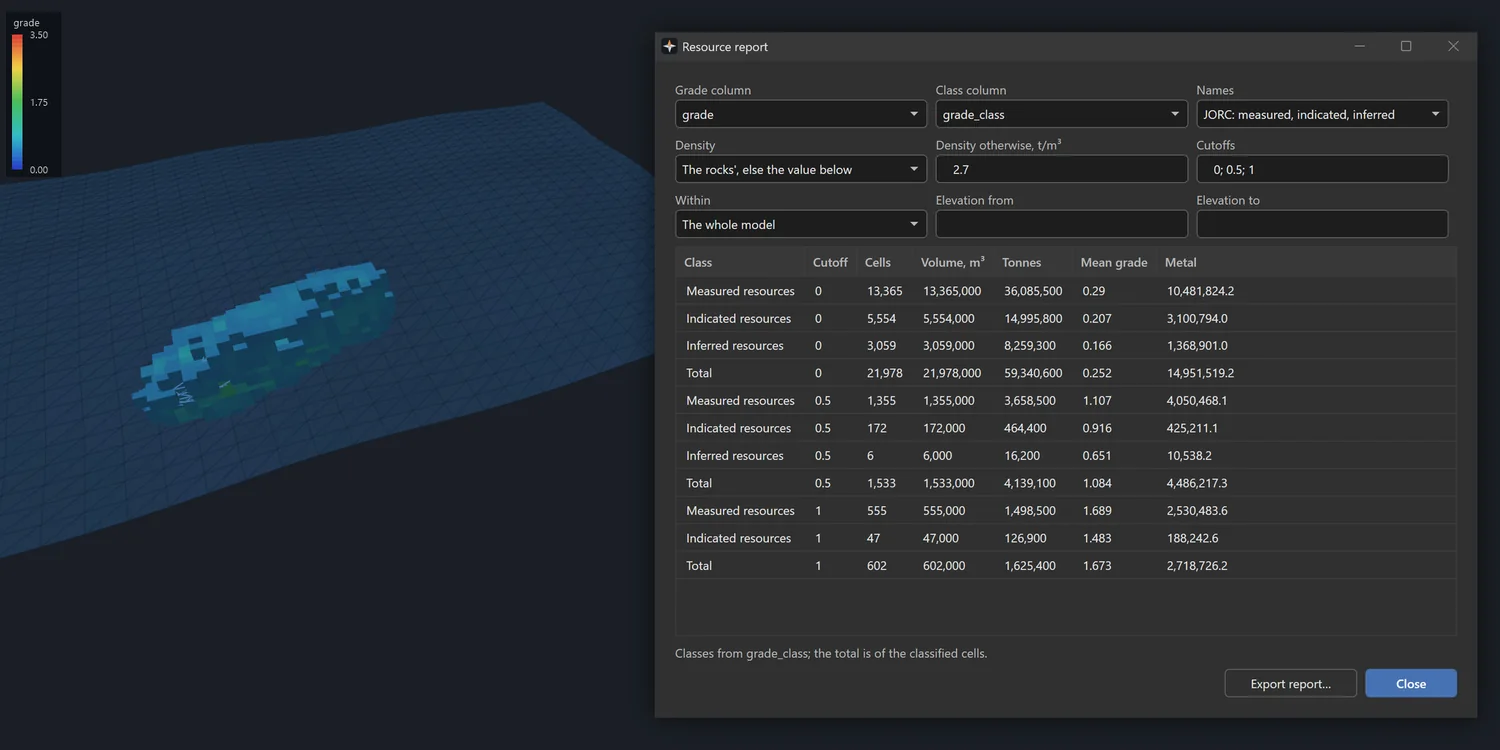
5. Write the resource report

The report by class at three cutoffs, over the cells of grade 0.5 and above

A table of cells, volume, tonnes, mean grade and metal by resource class above each cutoff. It updates as you change the boxes, and it can be limited to a closed wireframe, a closed line in plan or a range of elevations.

  1. Estimate a column so that it writes its number of samples and nearest distance, then run the Classify resources tool to get the class column.
  2. Run the Resource report tool and choose the grade column, the class column and the names: GKZ or JORC.
  3. Set the density and the cutoffs, separated by semicolons.
  4. If needed, limit the report with Within and Elevation from / to, and click Export report to write a CSV.

Result: the table on screen and in a CSV file; with a class column, the total is of the classified cells.

Read more in the guide →

Other sections

Try this section in the free demo

The demo is the full program: all six sections, nothing switched off. Windows 10 or 11, 64-bit.

Download the installer